Data Visualization with Seaborn in Python: FANG Stock Correlation Analysis
FANG, known as Facebook, Amazon, Netflix, and Google in the stock market, are considered very good investment in 2015. Thanks to the Python package Pandas and Seaborn, I am able to gather the adjusted close price and the volume on each day of last year of FANG stocks.
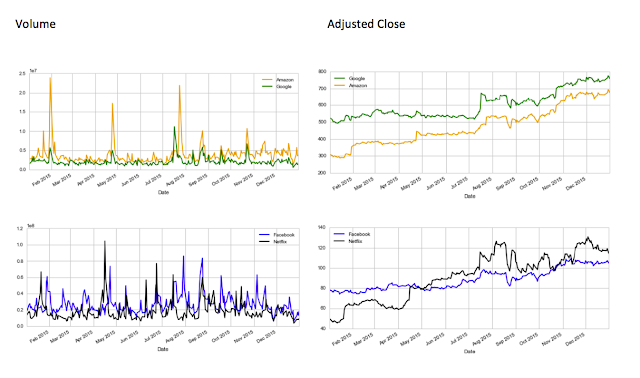
1. Volume and Adjusted Closing Price pattern of FANG in 2015
Amazon and Google has 3 significant peak volume in 2015. It's so interesting to see that the pattern of adjusted closing price of Google and Amazon are almost the same in 2015. It seems the Wall Street investors became confident in both Google and Amazon at the same time.
2. Daily Return Rate
The daily return rate is based on the percent change of adjusted closing price in a day. If you remember the sky-rocket rising stock price on the day when Amazon first released Amazon Web Service last year as well as the day when Google was announced to become one of the sub company of Alphabet, the chart below would be easier to be understood.
Below is the pair chart combined with Kernel Density of daily return rate of FANG. There's a strong correlation between stock price of Amazon, Google, and Facebook but Netflix seems not to be quite in the same path.
Follow up:
A lot of people asked me how I got all daily stock adjusted closing price of FANG stock. Please follow the instructions on my other blog to download the data with Python: Automatically stream and download the Yahoo! Finance stock price using Python.
1. Volume and Adjusted Closing Price pattern of FANG in 2015
Amazon and Google has 3 significant peak volume in 2015. It's so interesting to see that the pattern of adjusted closing price of Google and Amazon are almost the same in 2015. It seems the Wall Street investors became confident in both Google and Amazon at the same time.

2. Daily Return Rate
The daily return rate is based on the percent change of adjusted closing price in a day. If you remember the sky-rocket rising stock price on the day when Amazon first released Amazon Web Service last year as well as the day when Google was announced to become one of the sub company of Alphabet, the chart below would be easier to be understood.
Below is the pair chart combined with Kernel Density of daily return rate of FANG. There's a strong correlation between stock price of Amazon, Google, and Facebook but Netflix seems not to be quite in the same path.
The correlation between stock price of Amazon and Google is as high as 0.59 based on daily return rate while the correlation between Netflix and the other three companies is below 0.4. From all the analysis, I would like to ask the media why FANG considers Netflix as one of the member?
3. Risk vs Expected Returns
To dive deep,the next step is to analyze the risk of investing in FANG stocks. The way I defines risk in this case is to use the mean of the daily returns rate against the standard deviation of daily returns rate. The stocks of Google and Facebook are lower risk as well as lower expected returns.
So now you know the algorithm and code of stock market analysis, can you beat the Wall Street analysts and plan a portfolio of investment with 100% ROI?
Of course not!
The U.S. stock market is also impacted by a lot of global economic environment. The Europe stock market and the slow growth of China economy are believed to be two out of thousands main causes on the decreasing stock price of U.S. market this year. The Wall Street analysts implement much more complicated algorithm to calculate the possibility, correlation, and causality of any stocks, funds, or trusts.
A lot of people asked me how I got all daily stock adjusted closing price of FANG stock. Please follow the instructions on my other blog to download the data with Python: Automatically stream and download the Yahoo! Finance stock price using Python.


Comments
Post a Comment