Tableau Annual Conference 2014
Sep 8 to Sep 12, a huge data party took place in Convention Center in Seattle. It was an amazing week for any data enthusiasts from the data visualization industry. If you miss the conference, just search #data14 on Twitter or Instagram.
Monday Sep 8
Highlights of the Day: Lunch + Reception
I had a great lunch with Andy Kriebel, Bryan Brandon, and Alberto Cairo at the Cheesecake Factory just across the street of the Convention Center. It was my first meeting with the members from the Data Viz Team of Facebook!
Photo credits for Andy and Bryan. Andy shared his pictures on flickr. Check out here.


Monday Sep 8
Highlights of the Day: Lunch + Reception
I had a great lunch with Andy Kriebel, Bryan Brandon, and Alberto Cairo at the Cheesecake Factory just across the street of the Convention Center. It was my first meeting with the members from the Data Viz Team of Facebook!
Reception began in the late afternoon with the warm welcoming music. The giant rectangle screen streamed the live Twitter and Instagram data.. (Yes, we are pretty nerdy :P)
At the reception, I had a great talk with the data viz professionals. I got to learn that Product Consultant at Tableau was not just a sales person but also a technician for the product. The Product Consultants are responsible for training the employees of Tableau's client companies to learn how to use Tableau in their company, promoting the sales of Tableau software, and generating the visualization for Tableau's client companies.
And you might be surprised about the quality of food at the reception. They served sushi and yummy Chai Tea Latte. You could get California Rolls, Shrimp Rolls, and fresh Salmon Rolls as much as you wanted. : )
Tuesday Sep 9
Highlights of the Day: Christian Chabot's Keynote Speech + Data Night Out
I attended the fist Keynote by Tableau CEO Christian Chabot. People constantly applauded for the presentation of the new features of Tableau 8.2 Desktop.
One of the amazing feature is that in the new version of Tableau you can connect the dashboard with a website server by using only 30 lines of Javascript. In a just second, you can finish searching all the constructions in Seattle and visualized it immediately on the dashboard. Another new feature is the story point. Now in one dashboard, you can create more than two pages by adding the story point on the top of the dashboard. Another amazing feature is the Tableau Cloud and the iPad version of Tableau, which gave people the another new option to show the clients the dashboard they made!
Tuesday night is a party night! Tableau reserved the Seattle Center for all the data enthusiasts who registered for the conference. Space Needle, Chihuly Garden and Glass, and EMP museum were free for anyone who came to the party!
(Sorry I did not have many pictures for it..)
Wednesday Sep 10
Highlights of the Day: Neil deGrasse Tyson's Keynote Speech + Facebook talk + Facebook Party
Keynote on Wednesday was hosted by Neil deGrasse Tyson, whose talk was definitely one of the most funny talk at the conference. He listed some statements from newspaper he collected which included obvious statistical errors :P
One of the featured talks on Wednesday was Facebook Jeopardy: Hack Edition. Andy and Bryan showed the audience how to grab the data from the server and visualized it on Tableau to study which stickers at Facebook was popular in a month.
Another interesting featured talk on Wednesday was Porn, Pokemon, and Pop Culture: Using Data That Doesn't Suck. Andy, Jewel, and Peter told their story of Tableau using experience. Jewel's pokemon viz hit thousands of views on Reddit. Another great idea that might inspire fashion designers in NY is Jewel's dress. She collected the music type she listened everyday, generated a viz, and printed the viz on her dress!! A woman sitting in front of me took a picture when Jewel stood out in the front of the stage.
The Facebook party was a great place for people to share their ideas and thoughts. They delivered nice T-shirts and stickers to people who came to the party. Regardless the party was set up in a bar which you might see in any city, they decorated the atmosphere of the bar with their unique Facebook logo.
Thursday Sep 11
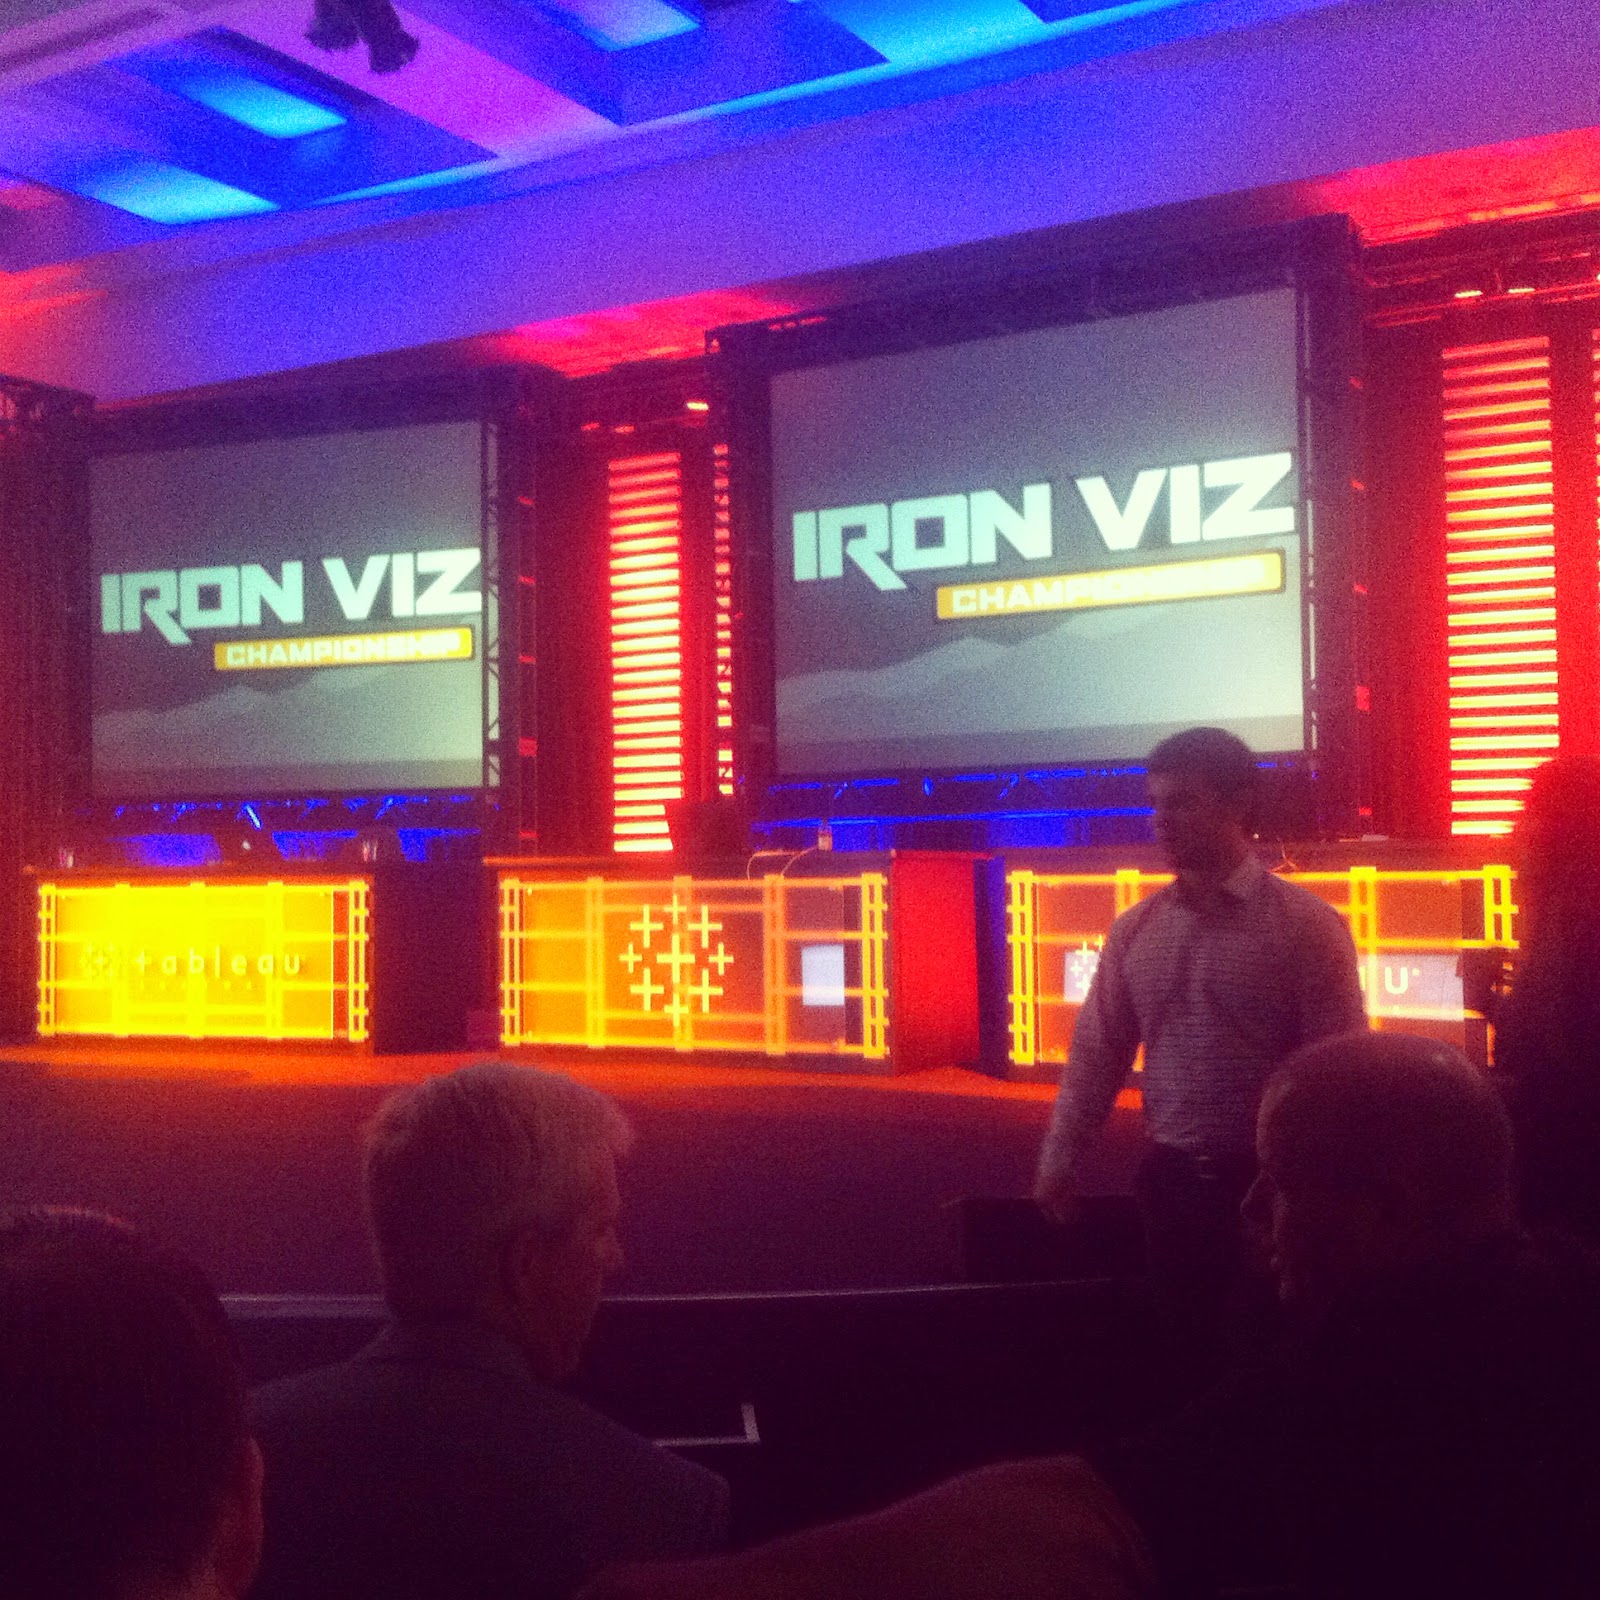
Highlights of the Day: Iron Viz Championship
My favorite professor at college Jeffrey Shaffer was one of contestants at the Iron Viz Championship. I want to say "Go Bearcat"!
During the contest, three contestants used the same data of Yelp to create their own viz. You might wonder if Prof. Shaffer's viz is a donut chart but wait.. That's not a donut chart!! You can select a number randomly from the chart so the viz can give you the optional restaurant.. Feeling lucky, right?
Friday Sep 12
Friday is the exam day. You can get $100 discounted price for the Tableau exam. But is it something missing? You are right. What will happen next year Tableau Annual Conference 2015?
SEE YOU IN LAS VEGAS!!
------------------------------------------------------------------------------------------------------------
Extra
I got a very nice photo from the photo booth at the conference. Tableau streamed my photo on the big screen before the Keynote. I already use the picture as my Linkedin and Twitter profile pictures.
I would like to end this pose with a picture of sunny Friday afternoon at Fremont as you know sunshine of Seattle, which is famous for rainy days, is very precious. :)
I am so pleased to know about this Annual Conference. I attended this conference two years ago at a local convention center in Seattle and it was quite impressive. We shifted to Orange County so couldn’t attend this year’s meeting.
ReplyDeleteI did not go to the one in Las Vegas either. I heard the conference was amazing.
Delete